


U.S. Frozen Fruit Market Data: How Buyers Should Read Cold Storage Reports Before Purchasing
Aug 27, 2026
Leave a message
Buyer guide · Updated August 26, 2026
A buyer-focused method for turning monthly USDA cold-storage figures into a cautious, reproducible sourcing signal-not a false availability claim.
Quick answer: Use the USDA Cold Storage report as a directional market signal, not as proof that a particular frozen-fruit SKU is available, cheap, domestic, uncommitted or suitable for your specification. Read the latest month against both the previous month and the same month last year, then separate commodity, format and region. Before changing a purchase plan, corroborate the stock movement with crop timing, import arrivals, price offers and supplier-level evidence.
Key takeaways for frozen-fruit buyers
- End-of-month stocks measure physical inventory in reporting warehouses. They do not measure open supplier offers, contracted stock, origin, grade, pack size or microbiological release status.
- A month-on-month increase can be a normal harvest-season build. A year-on-year comparison helps, but neither comparison explains the cause by itself.
- Do not merge IQF fruit, pails and tubs, drums, juice stock and concentrate when your application accepts only one format.
- Change volume, timing or supplier allocation only after a five-part check: report scope, seasonal pattern, crop and import flow, executable prices, and supplier evidence.

A procurement analyst compares monthly inventory evidence with berry samples before changing a buying plan.
What the USDA Cold Storage report actually measures
The U.S. Department of Agriculture's National Agricultural Statistics Service publishes the Cold Storage report each month. It covers end-of-month stocks held in public, private and semi-private refrigerated warehouses. The tables include national and regional quantities for frozen fruits, vegetables and other commodities, with comparisons to the prior month and the same date one year earlier. For a buyer, that makes the report useful for detecting inventory direction and unusual divergences between commodities.
The measurement point matters. The August 24, 2026 release describes stocks on July 31, 2026. It is not a real-time warehouse feed and it is not a forecast for September. Product could have been sold, moved, relabelled, committed or newly produced between the month-end snapshot and the day you read it. Treat the publication date, stock date and your RFQ date as three separate fields in your worksheet.
The NASS survey guide explains that the programme reports about 150 items across nine regions and that monthly estimates may be revised. Survey responses cover most storage capacity, while missing reports are estimated. Those facts do not make the data weak; they tell you the correct level of confidence. The report is a broad statistical view, not a lot-level inventory ledger.
Five commercially important facts are outside its scope. It does not tell you whether inventory is domestic or imported. It does not identify the owner of the stock. It does not show how much is already allocated under contract. It does not state grade, variety, Brix, defect tolerance, pesticide programme, pathogen verification or intended use. It also does not show an executable price. If your procurement question depends on one of those facts, the Cold Storage report cannot answer it alone.

Blueberry stock totals become useful only after format, origin, specification and allocation are confirmed.
Market inventory is not the same as inventory available to you
The most expensive interpretation error is to convert a national stock number directly into a purchasing conclusion. A buyer may see a large increase in blueberries and infer that suppliers should have abundant stock at a lower price. That skips several filters between the national total and an offer that can be loaded.
| Inventory layer | What it means | What the buyer still needs |
|---|---|---|
| Reported U.S. stocks | Physical product captured in the national survey at month end | Commodity, format, region and reporting date |
| Commercially uncommitted stocks | Volume not already reserved, contracted or internally allocated | Supplier allocation statement and offer validity |
| Specification-compatible stocks | Volume matching origin, variety, size, grade, testing and pack requirements | Signed specification, COA or test plan, sample and lot details |
| Logistically available stocks | Volume that can meet loading window, port, container and cold-chain requirements | Production or warehouse location, earliest load date and booking plan |
| Buyer-releasable stocks | Volume approved through your supplier and lot-release process | Document review, inspection, payment and final release decision |
A national figure can rise while the last layer remains tight. For example, the build may be concentrated in a region that is expensive for your delivery route, in drums when you require free-flowing IQF fruit, or in product that has already been committed to processors. Conversely, national stocks can fall while your contracted supplier still has a protected allocation that covers the next two production cycles.
This distinction is especially important for private-label and industrial users. A retailer may need a validated small-pack line, approved artwork and a minimum remaining shelf life. A yogurt producer may require a specific fruit preparation format and micro standard. A bakery may accept broken pieces that a retail whole-fruit programme rejects. The headline commodity total cannot resolve those application differences.
For storage and handling details, see Greenland Frozen Fruit Shelf Life.

Reported market stocks and loadable, specification-compatible stocks are different inventory layers.
Read three comparisons, not one percentage
Start with the absolute quantity, because a dramatic percentage on a very small base may have limited commercial relevance. Then review month-on-month, year-on-year and the normal seasonal position. Each comparison answers a different question.
1. Month-on-month: what changed since the last snapshot?
This comparison is sensitive to harvest and processing calendars. A July build in berries or cherries may reflect product entering freezers during the crop window. A decline may reflect normal drawdown between production seasons. Month-on-month movement is useful for detecting the speed and direction of change, but it is the weakest standalone basis for calling a market long or short.
2. Year-on-year: is this month unusual compared with last year?
The same-date comparison reduces some seasonal distortion. It can show whether current stocks are above or below the corresponding point in the prior cycle. It still cannot explain whether the difference came from crop size, imports, demand, survey revisions, quality constraints or delayed shipments. One year is also a narrow baseline; when the decision is material, check several years of the same month.
3. Seasonal pattern: is the movement normal for this commodity?
Plot at least 24 monthly observations when you can. Mark harvest and processing windows, major import seasons and your own demand peaks. The same 20 percent increase can mean normal replenishment in one month and an unusual accumulation in another. A seasonal chart also prevents buyers from treating a post-harvest high as proof of weak demand.
Keep revisions visible. If NASS revises the previous month, calculate the new month-on-month change from the revised figure, not from a number saved in an older slide. Record the release date and file link beside every extracted number so another buyer can reproduce the analysis.
Respect the SKU and format boundaries in the table
The fruit table contains more detail than the headline, but not every commodity is split the same way. Blackberries and red raspberries are divided into IQF, pails and tubs, 400-pound barrels and concentrate. Strawberries include IQF and poly, pails and tubs, barrels and drums, and juice stock. Blueberries appear as one national commodity line. "Other" is a large residual category that cannot be treated as a known mix of your target fruits.
Suppose you buy IQF red raspberries for retail bags. The total red-raspberry figure includes formats you cannot pack on the same line. The correct starting signal is the IQF line, followed by a supplier check on whole/broken ratio, variety, size distribution, free-flowing condition, pathogen controls, origin and available retail-pack capacity. Adding drums and concentrate to the numerator would overstate relevant supply.
Similarly, a strawberry processor accepting drums may view the market differently from a foodservice distributor buying whole IQF strawberries. Their raw commodity name is the same, but their usable inventories are not. The procurement worksheet should therefore contain a "report category accepted?" column. Mark yes, no or partial for every format before calculating a relevant total.
A structured worksheet keeps stock data, crop timing, trade flow, executable prices and supplier evidence separate.
Worked example: the July 31, 2026 frozen-fruit table
The August 24, 2026 NASS release reported total frozen fruit stocks of 1,100,710 thousand pounds on July 31. That was 112 percent of the June 30 level, or a 12 percent month-on-month increase, and 99 percent of July 31, 2025, or about 1 percent lower year on year. The combination is more informative than either percentage alone: stocks rebuilt sharply during July but finished near, and slightly below, the prior-year level.
| Reported category | July 31, 2026 (1,000 lb) |
Versus June 30, 2026 | Versus July 31, 2025 | Buyer interpretation |
|---|---|---|---|---|
| Blueberries | 232,881 | 138% of June | 109% of prior year | Strong July build and above last year; verify origin, grade, commitments and offers before inferring easy availability. |
| Total red raspberries | 91,249 | 309% of June | 129% of prior year | Large seasonal inflow; split IQF from pails, barrels and concentrate before using it for a retail-IQF decision. |
| Strawberries, total | 246,587 | 101% of June | 92% of prior year | Nearly flat month to month and below last year; the IQF/poly subline was also slightly lower on both comparisons. |
| Tart cherries, ripe pitted | 38,327 | 264% of June | 49% of prior year | A large monthly build can coexist with a major year-on-year deficit; do not describe the market from one horizon. |
| Peaches | 17,662 | 126% of June | 88% of prior year | Seasonal build but lower than the same date last year; obtain crop, pack-out and price evidence. |
| Other frozen fruit | 350,257 | 84% of June | 97% of prior year | Large but unidentified composition; unsuitable for a product-specific conclusion. |
Consider the red-raspberry line in more detail. IQF stocks were 65,287 thousand pounds, 343 percent of June and 142 percent of the prior year. Pails and tubs were 4,880 thousand pounds, only 86 percent of the prior year. Barrels were 18,367 thousand pounds, close to last year but more than three times June. Concentrate was 2,715 thousand pounds, a small absolute amount despite a large percentage increase. A buyer who reports only the 209 percent increase in total red-raspberry stocks hides the format mix and the base effect.
Now compare strawberries. Total stocks were almost unchanged from June, but the components moved differently: pails and tubs and barrels/drums increased, while IQF/poly and juice stock declined slightly. A frozen-fruit market commentary saying "strawberries were flat" may be statistically correct at total level and commercially wrong for a buyer restricted to one format.

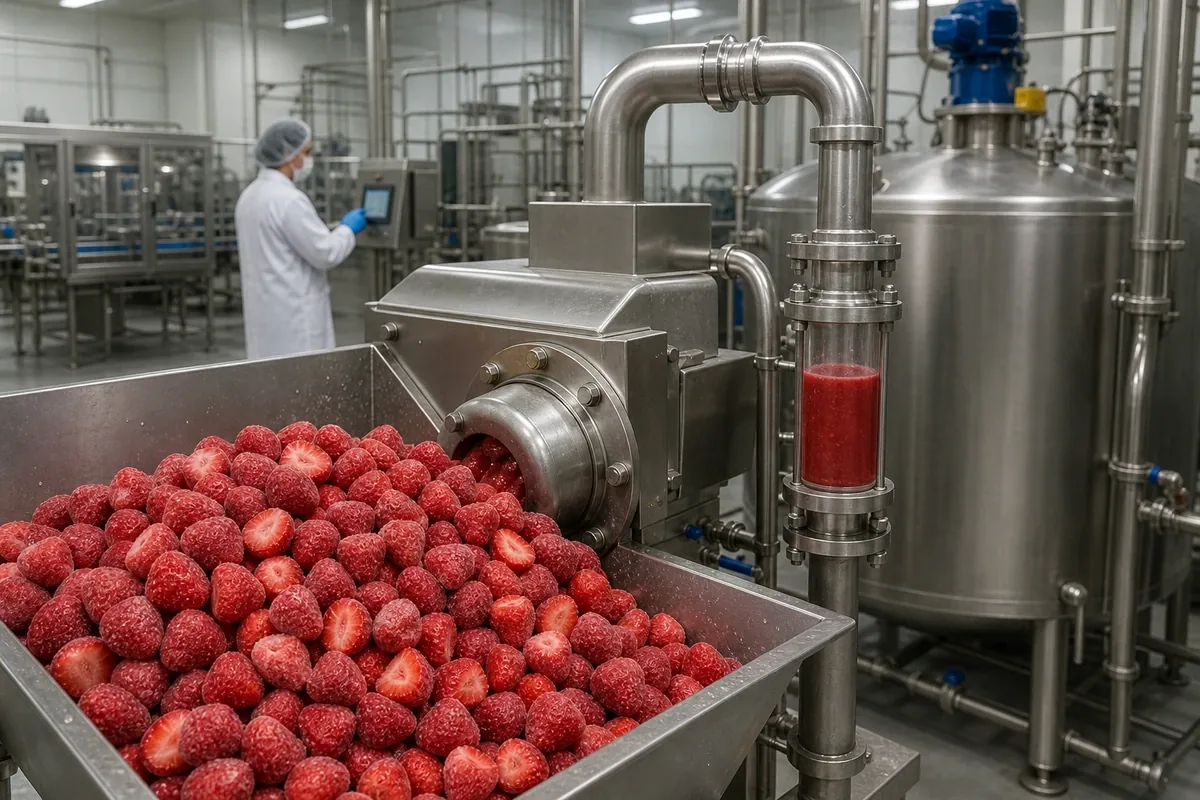
Strawberry totals can hide different movements in IQF fruit, pails, drums and juice stock.
Combine inventory with four other evidence streams
Crop and processing evidence
Ask which harvests are entering the table and which production windows have closed. Review crop condition, harvest timing, pack-out, grade distribution and processing capacity. Weather can change usable yield without moving national inventory immediately. A crop may produce adequate tonnage but fewer pieces meeting a whole-fruit or color specification.
Import and export flow
Cold-storage stocks can include imported product, but the report does not identify origin. Review recent customs data, known shipping windows, port arrivals and transit timing. A rising national total driven by one origin may not help a programme that excludes that origin or requires a different certification scheme. Also check exports and re-exports where relevant; inventory direction reflects both inflow and drawdown.
Executable price evidence
Collect comparable offers, not informal market comments. Normalize currency, Incoterm, net weight, pack, grade, origin, freight, duty, inspection and payment terms. Record the offer validity and earliest loading date. If two prices describe different whole/broken ratios, testing scopes or delivery points, they are not evidence of the same market level.
Supplier and lot evidence
Request available volume by exact specification, crop or production date, format, warehouse, commitment status and load window. Confirm whether the stock is finished and released, awaiting analysis, or merely forecast. For a new supplier, keep sample approval, facility documents and commercial allocation separate. A passed sample does not reserve volume, and an allocation does not prove the shipping lot matches the sample.

The final purchasing decision depends on lot release, documents, allocation and a workable loading plan.
A buyer worksheet for every monthly release
- Fix the decision. Write the SKU, application, destination, required load window and decision under review. "Should we advance our Q4 IQF blueberry order?" is useful; "What is the frozen-fruit market doing?" is not.
- Record the data identity. Save the NASS release date, stock date, table name, units and link. Note whether the previous month was revised.
- Map the report category. Decide which commodity and format lines are relevant, partly relevant or irrelevant to your specification.
- Calculate three views. Enter absolute pounds, month-on-month percentage and year-on-year percentage. Add a multi-year seasonal chart for material commitments.
- Write two competing explanations. For example, a stock build may mean a normal harvest inflow or slower demand. Do not select one without corroboration.
- Add crop and trade evidence. Note harvest progress, pack-out, import arrivals, origin constraints and logistics timing.
- Add commercial evidence. Compare at least two like-for-like offers and one supplier availability confirmation where practical.
- State confidence and action. Choose monitor, request more evidence, advance, defer, split volume or keep plan. Name the evidence that would change the decision.
Keep the completed worksheet with the sourcing file. It creates a decision trail and makes next month's review faster. More importantly, it prevents a statistic copied into a meeting deck from becoming an unsupported purchasing instruction.
Interpretation errors worth stopping in review
- Calling stocks "supply." Supply is a flow over a period; cold-storage stocks are a snapshot.
- Calling stocks "available supply." Ownership, commitments, specification and release status are unknown.
- Using only the total-fruit line. Commodity and format movements can point in opposite directions.
- Using only month-on-month change. Seasonal production can create large normal builds.
- Using only year-on-year change. One prior year may be abnormal and cannot explain cause.
- Turning a percentage into a price forecast. Price also reflects quality, origin, crop outlook, trade, freight, currency, demand and seller commitments.
- Ignoring units and revisions. The national table is in thousand pounds, and previous estimates can change.
- Presenting "other" as a known product. A residual category cannot support an exact-SKU conclusion.
How we use market data in a supplier discussion
Worked procurement decision: should a buyer advance blueberry volume?
Assume a U.S. foodservice distributor planned to contract 12 containers of IQF blueberries for October through December. The July 31 table shows 232.9 million pounds in storage, 38 percent above June and 9 percent above the prior year. The data is constructive, but it does not yet answer whether to defer, advance or split the order.
The buyer first checks category fit. The NASS blueberry line is not split by IQF, pail, origin, grade or region in the national table. The distributor requires cultivated blueberries, free-flowing IQF, no added sugar, a defined diameter range, an approved pathogen-control programme and 10-kilogram cartons. It therefore records the full NASS line as a broad signal with low specification precision.
Next comes seasonality. July is a normal production and inventory-build period for North American blueberries. The buyer plots the previous 36 months and confirms that large July and August builds are common. The 38 percent rise no longer looks like evidence of unsold distress inventory; it looks like a seasonal inflow that happens to finish above last year.
For storage and handling details, see How Long Do Frozen Blueberries Last?.
The import check shows scheduled arrivals from two origins during the buyer's coverage period, but one origin is not approved for a key customer. The crop check indicates reasonable volume while reporting a higher share of smaller fruit. That matters because the distributor's specification has a lower-size limit. The headline stock total may therefore overstate usable volume for the programme.
The buyer then normalizes three offers. Supplier A quotes the exact grade with October loading and a 14-day validity. Supplier B is cheaper but offers a broader size range and excludes destination testing. Supplier C has approved product but only six containers uncommitted. Once testing, inland delivery and yield are aligned, Supplier B is no longer the cheapest. The comparison also shows that the large national stock figure has not translated into a uniformly lower executable price.
The decision is to secure six containers with Supplier C, keep four with Supplier A subject to sample confirmation, and wait two weeks before placing the final two. The worksheet records a medium-confidence view: national inventory is supportive, but specification-compatible allocation is not abundant enough to defer everything. The next evidence trigger is the August stock report plus current-crop size-distribution data.
This example shows why the report is valuable. It did not produce a price forecast. It changed the questions, exposed a size-grade risk and supported a staged commitment. That is a defensible use of public inventory data.
Governance for the monthly market review
Assign one owner to extract the report and a different reviewer to challenge the interpretation. The extractor should not write "bullish," "bearish," "tight" or "long" in the data table. Keep observation and inference in separate columns. "Blueberry stocks were 109 percent of last year" is an observation; "buyers can delay purchases" is an inference that needs commercial evidence.
Use a fixed cut-off for supplier quotes so the report review does not compare offers collected under different freight or currency conditions. Archive the original report, calculations and offer normalization. At the next meeting, score the previous decision against what actually happened. This calibration helps the team learn which indicators are useful for each commodity and which narratives repeatedly fail.
At GreenLand-food, we use public market data to sharpen questions, not to substitute for a supplier confirmation. For a frozen fruit enquiry, we confirm product form, variety or grade, origin preference, application, pack, testing expectations, destination and load window. We then ask the relevant production partner to confirm specification fit, document availability and an order-specific offer.
If you are screening a wider range, you can review our frozen fruit range and download the GreenLand frozen-food catalog. A useful first message includes the exact fruit and format, annual or trial volume, destination port, expected shipment month and any destination-market testing requirements.
Frequently asked questions
Does higher U.S. cold-storage inventory mean frozen fruit prices will fall?
No. Higher inventory can add downward pressure in some circumstances, but the report does not show ownership, commitments, grade, origin, cost or demand. A seasonal build can occur while the particular SKU you buy remains constrained. Use comparable supplier offers, crop and trade data, and specification-level availability before changing a price assumption.
Can importers use the USDA report to decide whether domestic supply can replace imports?
Not by itself. The report does not separate domestic from imported stock and does not show whether the inventory matches your product, format, quality, certification, pack and delivery requirements. It can trigger a domestic-supplier check, but replacement requires like-for-like technical, commercial and logistics evidence.
Turn the signal into a specification-level RFQ
Send us the fruit, format, grade, pack, destination and shipment window you are reviewing. We will confirm what can be matched through our frozen-fruit supply network and return an order-specific document and quotation plan.