


The Same Average Is Not the Same Consistency: Comparing Frozen-Ingredient Lot Data
Sep 29, 2026
Leave a message
Research This Article & Topic with AI
Verify key claims, compare reliable sources, and explore GreenLand-food's practical frozen food knowledge.
Article details and research questions are prepared in the links. Sign-in or sending may be required.

A buyer evaluating a consistency claim should request representative repeated measurements with their lot and sample identities, read the within-lot and between-lot patterns separately, and compare the distribution with the signed specification and the ingredient's application. One certificate of analysis is evidence about one defined lot and test plan; it is not a trend chart.
This distinction is practical for IQF corn sweetness, frozen strawberry size, broken-piece percentage, drip loss or a formulated fruit puree endpoint. A blending plant may absorb modest variation in one measure and struggle with it in another. Before asking for statistics, identify which characteristic affects the finished product and how it is measured. Then keep the product form, method, units and sampling basis stable long enough for the data to be compared.
GreenLand-food supplies frozen ingredients by confirmed product form, specification and lot documentation. Our frozen corn COA guide helps read an individual lot report, and our strawberry production article explains records and traceability. This page addresses the next purchasing question: what a series of correctly identified results can and cannot say about consistency. The numbers in the example are invented solely to explain the reading method, not GreenLand performance data.
The same average can hide a different distribution
Imagine two hypothetical IQF sweet corn datasets, each made from four independently selected packs from one defined lot and measured by the same soluble-solids method. Supplier A reports 9, 10, 10 and 11 °Brix. Supplier B reports 6, 9, 11 and 14 °Brix. Both arithmetic means equal 10 °Brix, but the second set covers a much wider range. If the buyer's illustrative application required each pack to fall within a stated band around the target, the two sets could lead to different acceptance decisions. No actual buyer limit or supplier result is implied by these teaching values.

The illustrative datasets share a mean but differ greatly in their tails.
The average answers a narrow question: where is the center of the observations that were included? It does not say how often a carton will be too sweet or too bland, how many pieces fall outside a size band, or how an occasional high-drip pack could affect a bakery line. A single average can also be pulled by an extreme value, while the median and full range tell a different story. Show the individual readings, a suitable summary of spread and the sampling basis before reducing the purchase decision to one number.
The contracted specification comes first. Its terms may set a minimum lot result, an individual-pack tolerance, a defect percentage measured on a defined sample, or a sensory approval against a reference. These are different rules. If the contract specifies only a composite lot mean, it cannot be silently interpreted as a guarantee that every inner bag meets that value. If the final use needs pack-to-pack consistency, write an appropriate sampling and decision rule with the laboratory and production team. The NIST process-capability explanation makes the broader point that both variation and specification limits matter when assessing capability.
Distribution also needs a food-specific interpretation. A natural fruit ingredient is not a machined component. Crop maturity, variety, size sorting, cut form and packing can create expected variation. A wide spread is not automatically evidence of process failure if the offered grade and application allow it. The buyer still needs to know that spread in advance. A smoothie producer may blend around normal strawberry Brix variation, whereas a retail pack with visible whole berries may reject a large color or size tail. The value of the data lies in connecting a measured pattern with an actual use and agreed limit.
An attractive chart can still mislead if the observations are not representative. Four packs selected from the front of one pallet say little about cartons at other positions. A result generated from one homogenized composite is not a set of four individual-pack readings even if the instrument was run four times. Before comparing two means, ask what the rows represent and how the material reached the laboratory.
The report should show the number of observations behind each plotted point. A point based on one pack and a point based on ten cartons should not look equally certain because their symbols have the same size. State whether the value is an individual reading, a mean of packs, or a composite. If a buyer compares several suppliers, keep the same definition and comparable sampling effort. Otherwise a supplier with more testing may appear to have more outliers simply because its variation has been observed rather than averaged away.
Separate within-lot and between-lot variation
A production lot is a defined manufacturing or packing quantity with a traceable code. Within it, different cartons, inner bags and portions can vary. Across lots, raw material, crop date, processing adjustment or pack configuration may also change. These are nested sources of variation. Keep the structure in the dataset: production lot, carton or bag, sampling location, prepared portion and analytical replicate. If the hierarchy is lost, a spreadsheet can make technical repeat tests appear to be independent shipments.
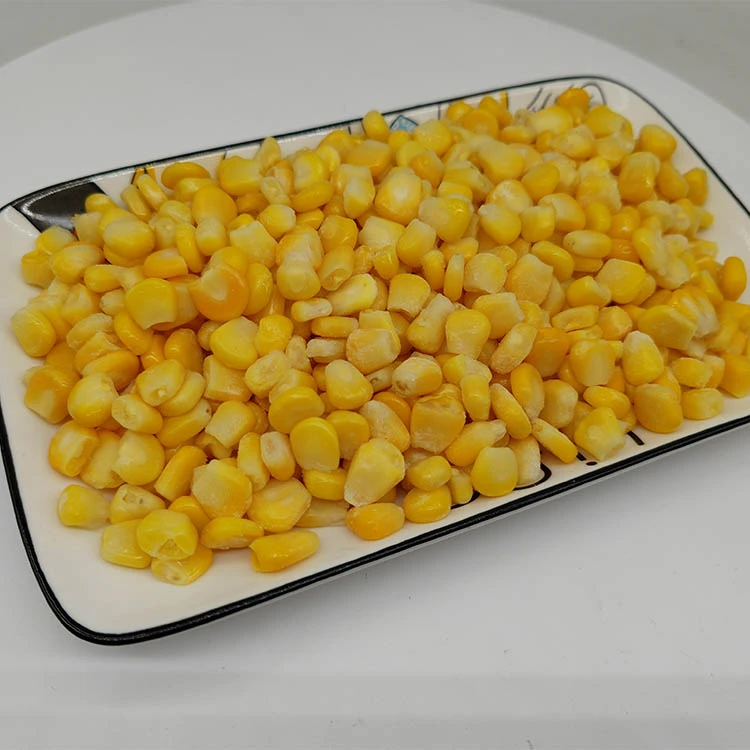
Real corn product form helps identify the unit being sampled; the chart values are unrelated examples.
For a corn example, a buyer might sample several cartons in each production lot, prepare one or more portions from each carton under a common method, and retain the actual carton code with every result. The number of cartons and portions depends on the decision, lot size, expected variation and test cost; no universal plan follows from the example. The GreenLand corn-kernel page describes the commercial forms and attributes that would need to be fixed before such a comparison. An image of kernels is evidence of the offered form, not a statistical sample of the supplier's historical distribution.

The sampling level must stay attached to every measurement.
Analytical replicates answer whether the laboratory can repeat a reading on the same prepared material. Independently prepared portions can reveal preparation variation. Packs from different cartons reveal some within-lot variation. Results from different production lots reveal between-lot change. These levels are not interchangeable. If the lab reports three decimal readings from one puree cup, treating them as three separate production lots inflates the apparent evidence and can make a claimed trend look smoother than it is.
Look for both the average within each lot and the spread of that lot's sampled units. A supplier could maintain a stable overall mean while its within-lot spread widens, perhaps because material from different parts of a process is less uniform. Another could keep each lot tightly grouped while the lot means shift from week to week. The buyer experiences these patterns differently. A line that draws from one carton at a time may be sensitive to carton-level shifts; a central blending tank may smooth some of them while still needing a reliable lot mean.
NIST's worked Shewhart-chart discussion explicitly separates within-lot from lot-to-lot variation when choosing a monitoring chart. That statistical structure carries into frozen-food purchasing: choose the observation unit that matches the question. Keep raw measurements available for qualified analysis even if the routine buyer report presents a simpler trend. A summary should tell the buyer what was averaged, not merely display a polished line.
The sampling plan should also record the fate of unusual units. A broken bag or visibly damaged carton may require a separate condition investigation, but it should not vanish from the dataset because it spoils the average. Conversely, a known measurement failure should be identified rather than treated as a true extreme ingredient result. The reason for exclusion, repeat or replacement belongs in the file before conclusions are drawn.
For multi-component frozen mixes, state whether the measurement belongs to the whole blend or a separated component. A composite color score for peas, corn and carrot cannot explain which component changed. A portion-weight result may be stable while blend ratio varies among packs. The lot hierarchy should therefore include the product definition and, where relevant, component identity. This is another reason to begin with the finished-food effect and then choose the measurement, instead of collecting many convenient results and searching afterward for a purchasing story.
Keep measurements comparable over time
A trend is meaningful only when later points answer substantially the same question as earlier points. Product form, variety program, crop year, size band, sample location, laboratory, preparation temperature, analytical method and reporting unit can change the result. Record those details with each point. A sudden shift coinciding with a method revision may reflect a new method rather than a new fruit or corn condition. A stable trace that combines whole berries and processing-grade fragments may conceal a commercial change because the series itself is no longer one product.

GreenLand whole IQF strawberries illustrate a form that needs its own comparable data series.
Frozen strawberry examples make this concrete. Whole, halves, dice and puree have different measurement bases and different relevance to an application. A drip result from whole fruit thawed under one preparation should not be plotted beside a result from diced fruit thawed under another and described as one improving supplier trend. The GreenLand IQF strawberry product page treats those forms as distinct specifications. The buyer's dataset should do the same, even when the material comes from the same broad fruit category.

The illustrative upward pattern is easier to recognize in time order.
Time order matters. A supplier might report ten lots with the same overall mean as another supplier, yet the first stays close to target through the period while the second moves progressively toward a limit. Plot results by production date and keep shipment and sample dates available. Note a crop transition, changed factory line, different screen size or revised laboratory method on the chart. This does not prove which event caused a shift, but it tells the technical team where to investigate. The ASQ control-chart guidance describes why time-ordered data and limits derived from history are used to study process behavior.
Maintain the original result as well as a harmonized summary. If one laboratory reports moisture on a wet basis and another on a dry basis, first confirm the conversion and method comparability. If a defect category is redefined, do not simply append the new percentages to the old line. Where conversion is defensible, document it; otherwise start a separate series and bridge the methods with paired samples. Procurement should know when an apparent improvement is partly a reporting change.
The need for comparability extends to accepted samples. A retained reference can age in frozen storage or be altered by repeated opening. If the buyer uses a physical reference for color or texture, keep its role and version alongside the numeric series. Updating the reference without a bridge comparison changes the interpretation of later judgments. Numeric data and physical samples are strongest when their identities and handling histories remain traceable to the same lot and specification version.
Report the denominator for percentages. A broken-piece result based on mass is not directly interchangeable with a count of broken pieces, and a foreign-matter result per inspected kilogram differs from a result per pack. If one laboratory rounds values to whole percentages and another keeps decimal places, apparent ties may conceal small differences. Precision should reflect the validated method rather than a spreadsheet format. Document these details once in a method key attached to the trend, so every purchasing review does not have to rediscover them.
Read the time sequence before a capability index
A control chart and a specification have different jobs. Specification limits come from the purchase requirement or applicable rule and define acceptable product. Control limits are calculated from a stable process history and help identify unusual changes in that process. A series can remain inside its historical control limits while some product fails a tight buyer specification. It can also cross a control limit without an immediate specification failure. Present both clearly rather than drawing one unlabeled band around the data.

Specification and control limits serve different decisions.
Start by looking at the plotted individual or grouped results. Is the center steady? Does the spread widen? Are there clusters by crop, line or packing day? Are there sudden changes after a method or raw-material switch? NIST's stability guidance says a process needs a constant mean and variance over time before capability can be interpreted. If the history is sparse or changing, a capability number creates an impression of precision that the evidence does not support.
Do not calculate or advertise Cpk from a few supplier COAs as if it proves frozen ingredient reliability. A qualified statistician or technical specialist should choose appropriate subgroups, examine measurement-system behavior, test the stability assumptions and account for the distribution and sample design. The buyer can still make a practical decision without an index: review recent lot results against the contract, identify shifts or excessive spread, and agree a targeted follow-up plan. A statistical tool should sharpen that decision, not replace the product and application context.
For characteristics that are percentages or counts, the correct chart and treatment may differ from a simple line of continuous measurements. Broken-piece percentage, foreign matter counts and Brix do not share one distribution or sampling rule. Results near a detection limit also need special handling. Keep the raw facts and the defined acceptance method available for technical review; do not force every frozen-food property into the same capability calculation because one software button is available.
Finally, remember that a control chart watches a process over time, while lot acceptance acts on a defined shipment or production lot. The Canadian food-quality statistics guide distinguishes these roles. A favorable historical trend can help qualify and monitor a supplier, but the current lot still needs the evidence specified for its release. A single current pass does not erase a concerning long-term drift that procurement should discuss before the next order.
Preserve missing results and qualification changes
Missing data are themselves information. If every failed or borderline sample was retested but only passing values appear on the buyer report, the trend is biased. If a test was not run because the laboratory was closed, mark it as not measured and explain the reason. A blank, zero and "below detection limit" do not mean the same thing. Preserve the original report wording and method detection or quantification limit where it matters. Do not fill a gap with the previous month's value to make a smooth chart.

A missing or censored result cannot be replaced with zero.
Retests require a defined rule. The original result, sample identity, reason for repeat, preparation differences and final decision should remain visible. A second reading can investigate analytical error, while a fresh carton may investigate lot heterogeneity; selecting whichever value looks more favorable changes the evidence question after the fact. Qualified QA and the laboratory should agree how discrepant results are handled before the next claim. Food-safety positives require their own controlled disposition process and cannot be treated as an ordinary quality trend that disappears after a negative retest.
Supplier qualification changes deserve the same transparency. A new crop origin, added processing site, revised grade, larger pack or new method may create a legitimate new baseline. Label the transition and collect enough representative data under the new condition before claiming that old stability continues unchanged. If the buyer changes its formula or line, the critical product characteristic may also change. Retain the old series for history, but state which new use and acceptance rule the new data support.
A useful data request is modest and precise: several recent representative production lots; the relevant sample and carton identities; the actual results and units; specification version; method version; dates; repeat and missing-result flags; and any known crop or process transitions. Ask for raw values where feasible, not only a green dashboard. The purpose is to make the claim auditable and to identify a manageable next action, not to demand every internal production record without regard to the purchase decision.
Visualize censored values faithfully. A laboratory report reading "less than 10" does not mean zero, five or ten. On a plot, use a distinct symbol or annotation and preserve the reported threshold. If the method's limit changes, the series may appear to improve without any product change. For microbiological attributes in particular, the qualified food-safety team must interpret the result under the applicable method and decision plan; the simple quality trend illustrated here must not be used to redraw a pathogen release rule.
Turn the observed pattern into a purchase action
Different patterns call for different actions. A stable mean with widening within-lot spread may justify checking sorting or mixing and sampling more cartons per lot. A shift between crop periods may call for an application trial and a new approved sample. A few isolated abnormal packs may need a condition and packing investigation. A consistently centered, narrow distribution across representative lots can support a more predictable order plan, provided the current specification and method remain applicable. The data should lead to a question the supplier and buyer can test, not a vague "improve consistency" request.

Translate a documented pattern into a specific purchase action.
Write the purchase decision against the intended application. For IQF corn, a buyer may need sweetness and kernel size to stay within a defined window because portion appearance and cooked flavor matter. For strawberry dice used in a visible dairy product, color and size spread may matter more than small differences in average Brix. For fruit puree, separation and formula behavior under a common preparation may be more useful than whole-fruit appearance. If a proposed tighter specification has cost or crop-availability implications, compare that change with process adjustments and an alternative grade before deciding.
When onboarding a replacement source, use a stable baseline. Compare the new source's form, method and representative lot distribution with the currently accepted ingredient under the same application trial. Do not compare a single carefully selected approval sample with a year of production history from the incumbent. Record the transition rule, the first monitored lots and who may approve a specification change. The resulting agreement can name extra monitoring for an introductory period without pretending the new supplier already has a long track record.
At GreenLand-food, we can discuss product form, lot identification, sampling and the documents needed for a comparable review. We can also prepare a quotation against the buyer's confirmed quality targets, packing, quantity, destination and application. The most useful supplier consistency claim is one that a purchasing team can trace from individual measurements through production lots to a decision it can repeat. Equal averages are only the starting point for that conversation.
Source Frozen Food with GreenLand-food
GreenLand-food manufactures frozen food in China. We fill factory-direct wholesale orders for importers, food manufacturers, distributors and private-label programs.
Send the product form, specification, packing, quantity, application, destination, private-label needs and requested documents for a matched offer.